More Water Runs to It

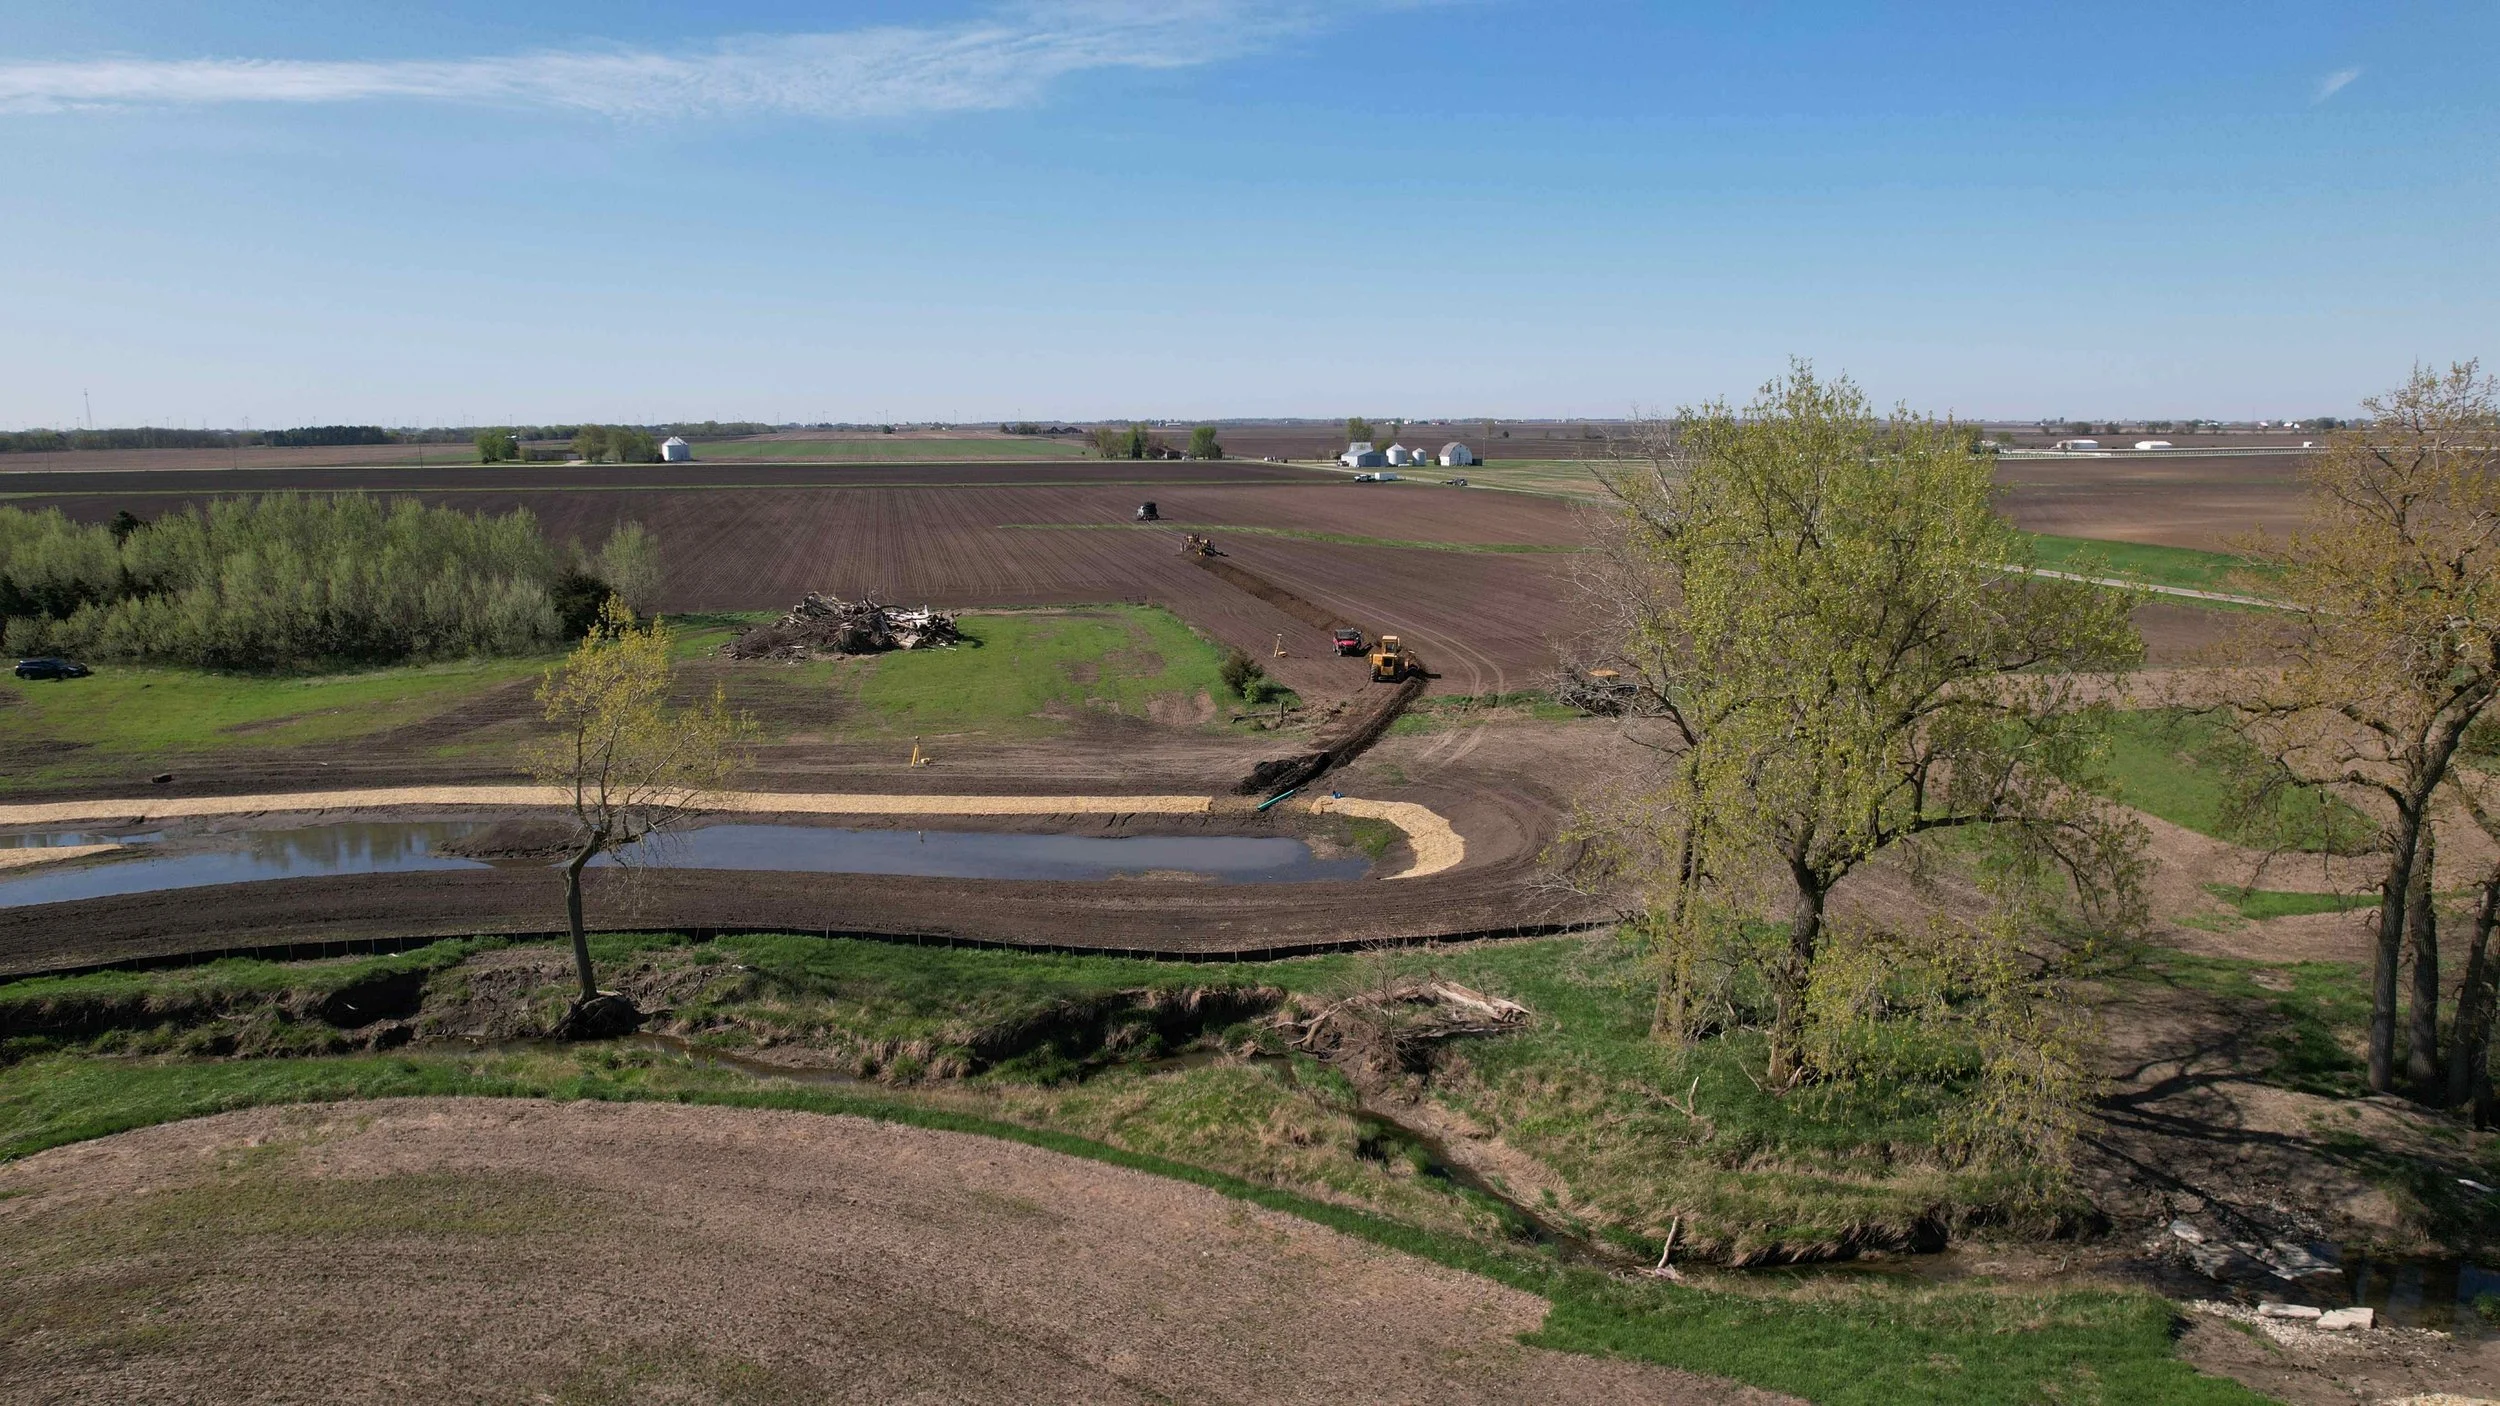
Even though the Smart Wetland at Feather Prairie Farm was constructed in August 2022, it is now fully operational after another ag tile drainage line was added to it earlier this month.

For those not familiar with agricultural tile drainage, it is a system that removes excess water from the soil under farmland. Removing excess water allows for easier planting and harvesting, improved soil conditions for crop growth, and allows farmers more control over scheduling fieldwork.

The second line was installed at the west end of the wetland. It was connected to tile lines in the field south of the wetland. There were a few surprises. Seven unmapped tile lines were discovered in the process of connecting the tile main to the wetland. However, Trent, Travis, and Titus from Double S Tiling quickly connected them to the system, and soon more water was trickling into the wetland.

Here are some photo highlights of the process.

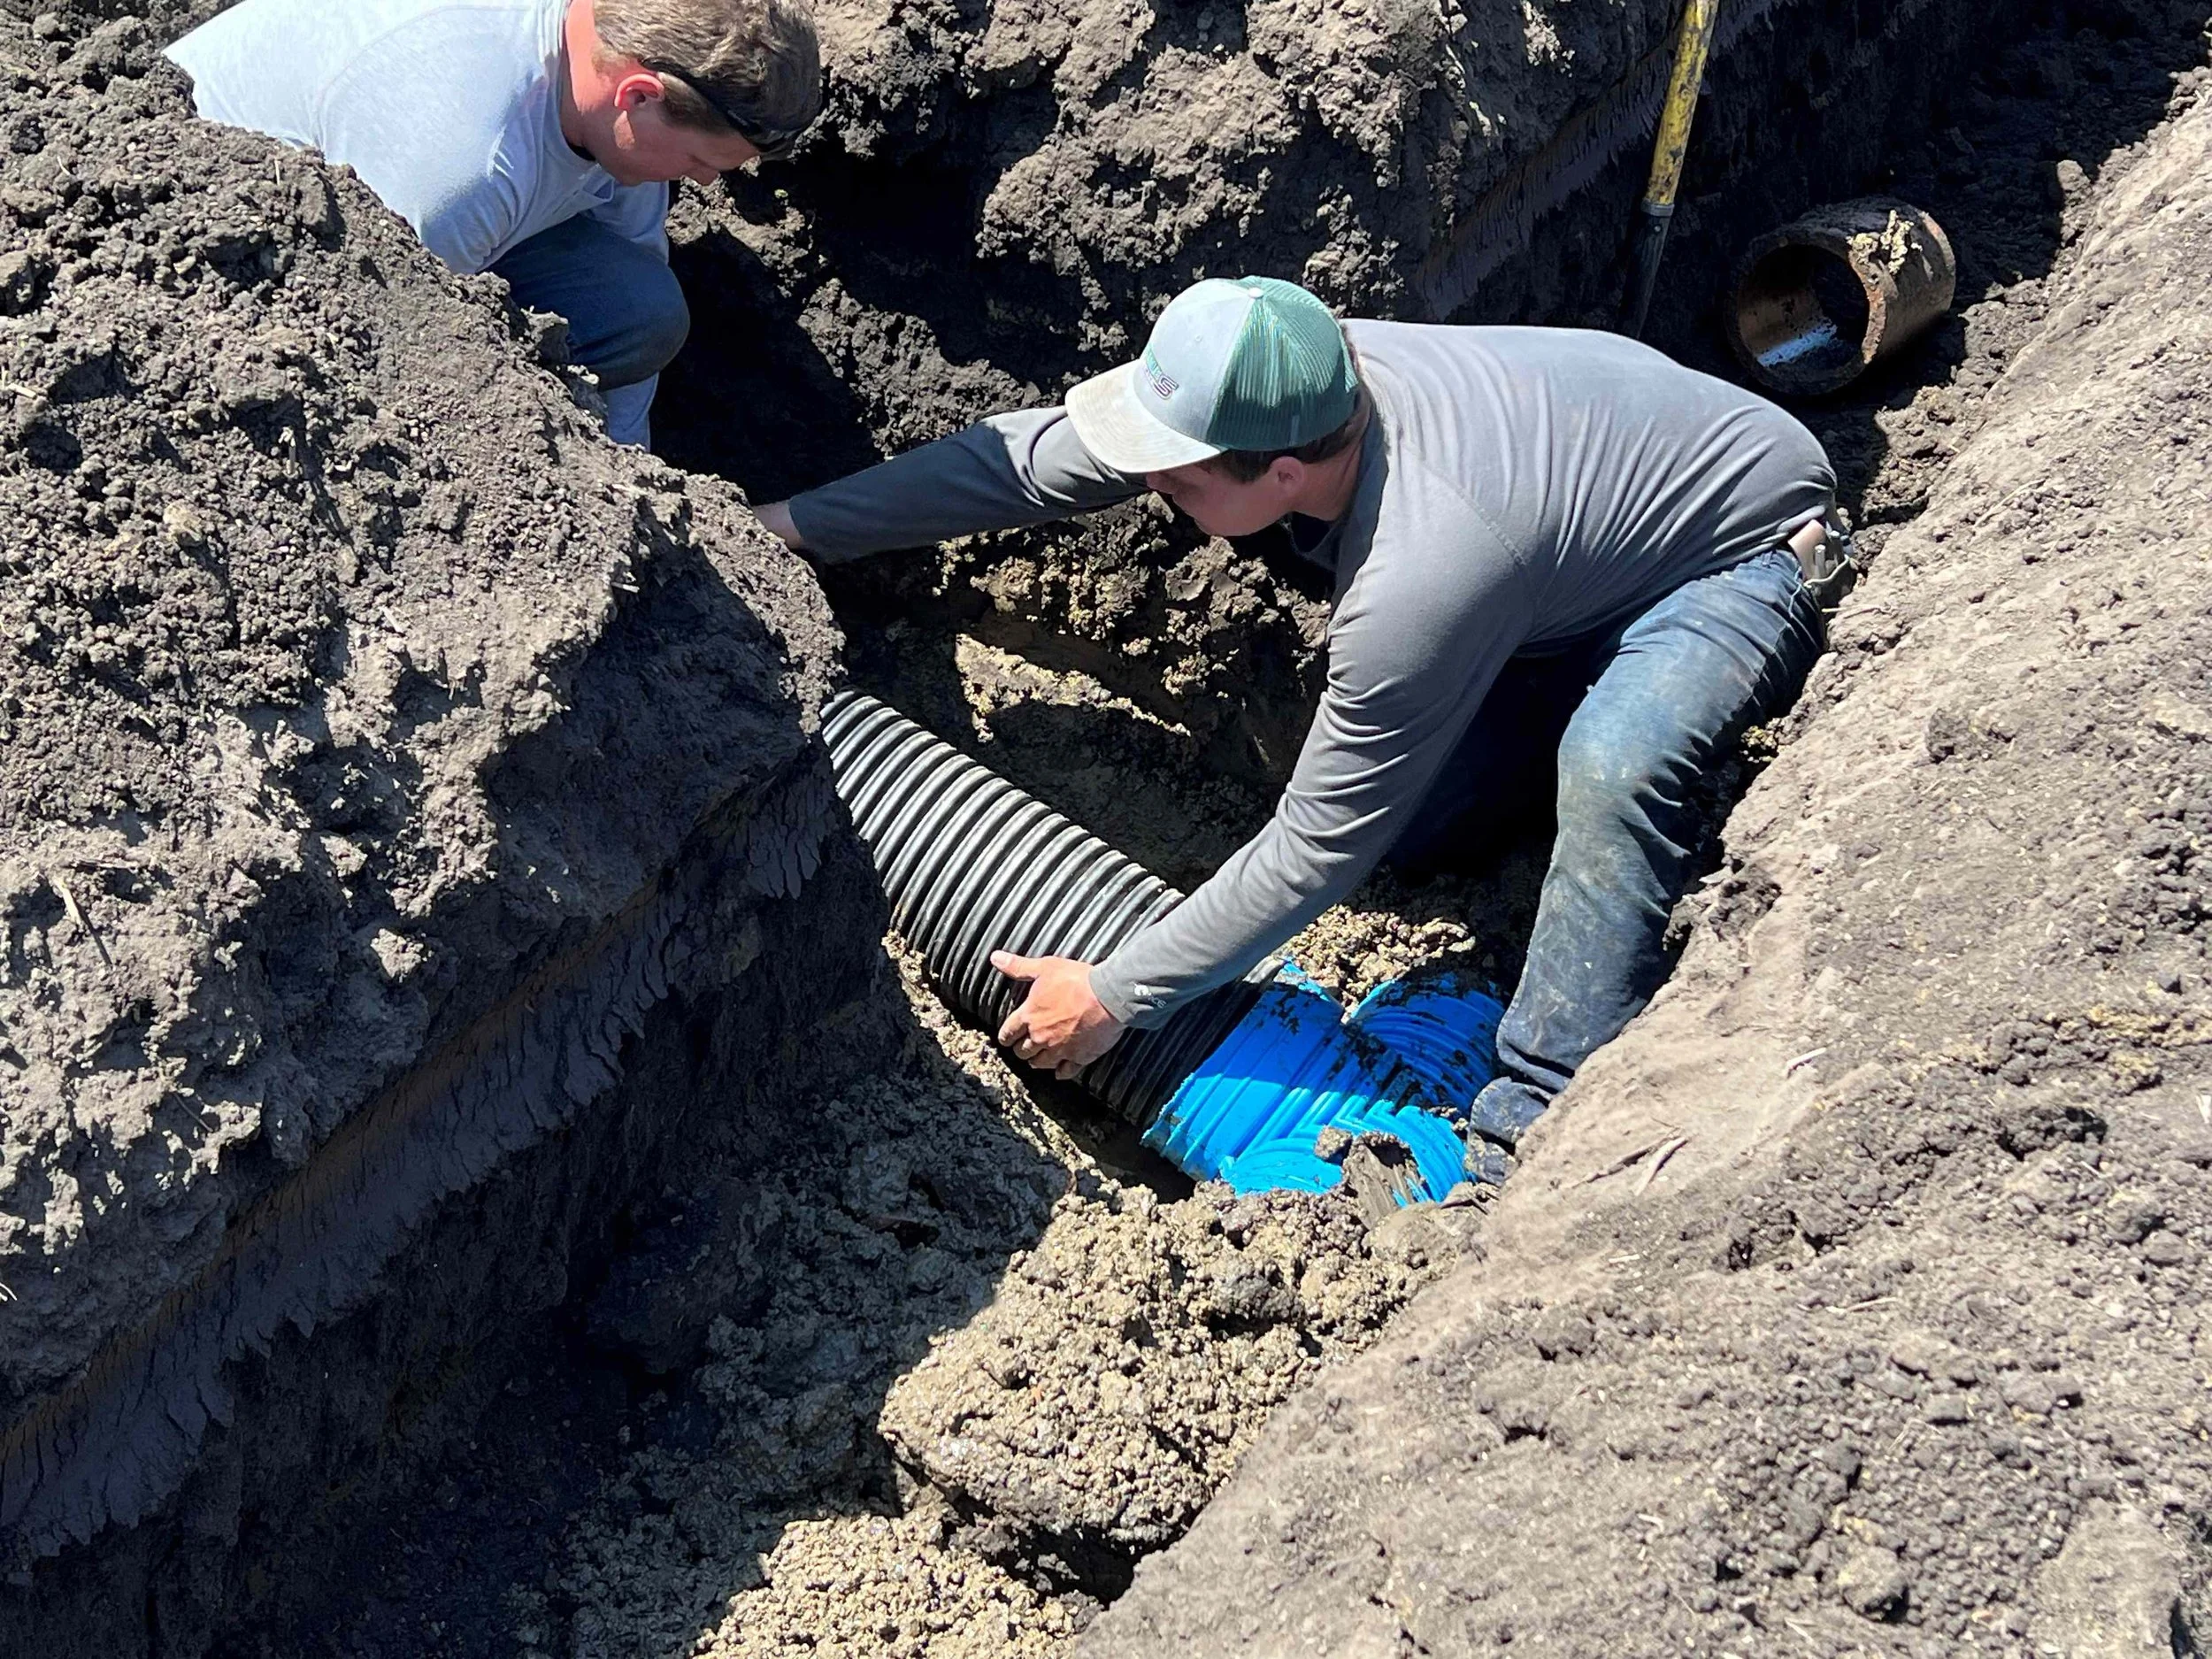
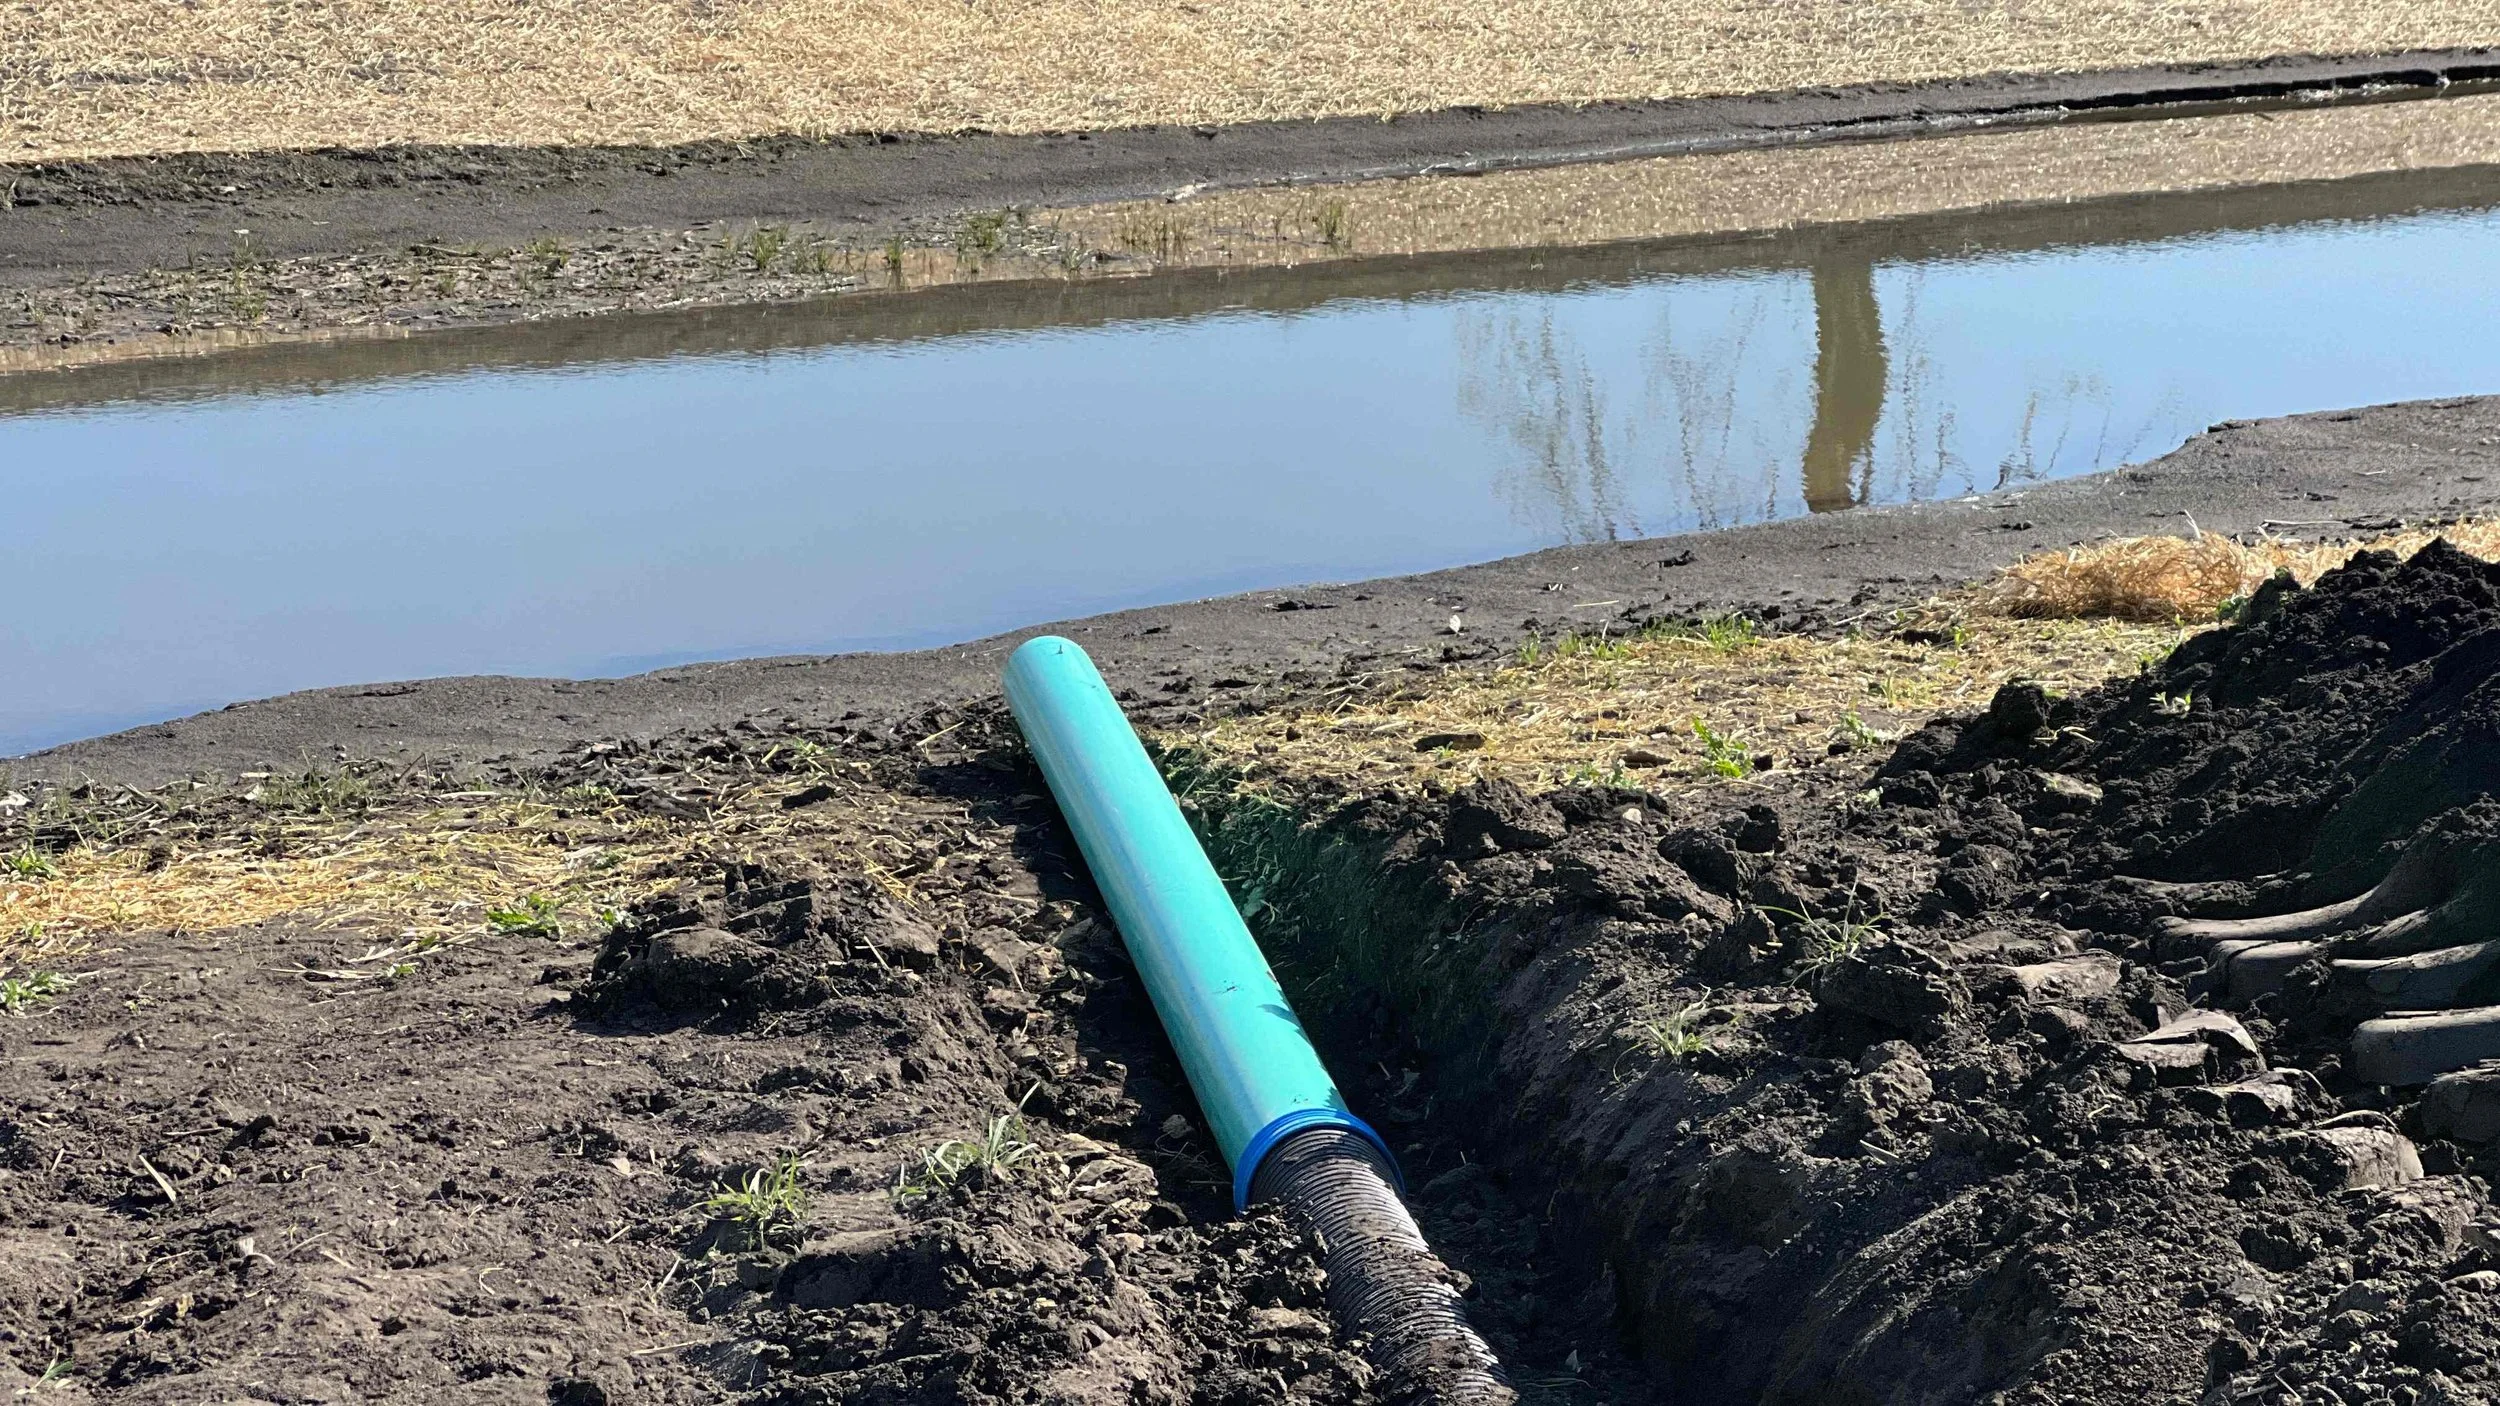
The crew started at the wetland by installing the solid outlet pipe (blue). Then they connected it to the beginning of the black, plastic, corrugated, and perforated pipe that would be buried from that location across a field and connected to the main ag drainage tile line that would supply the water that will flow into the wetland.

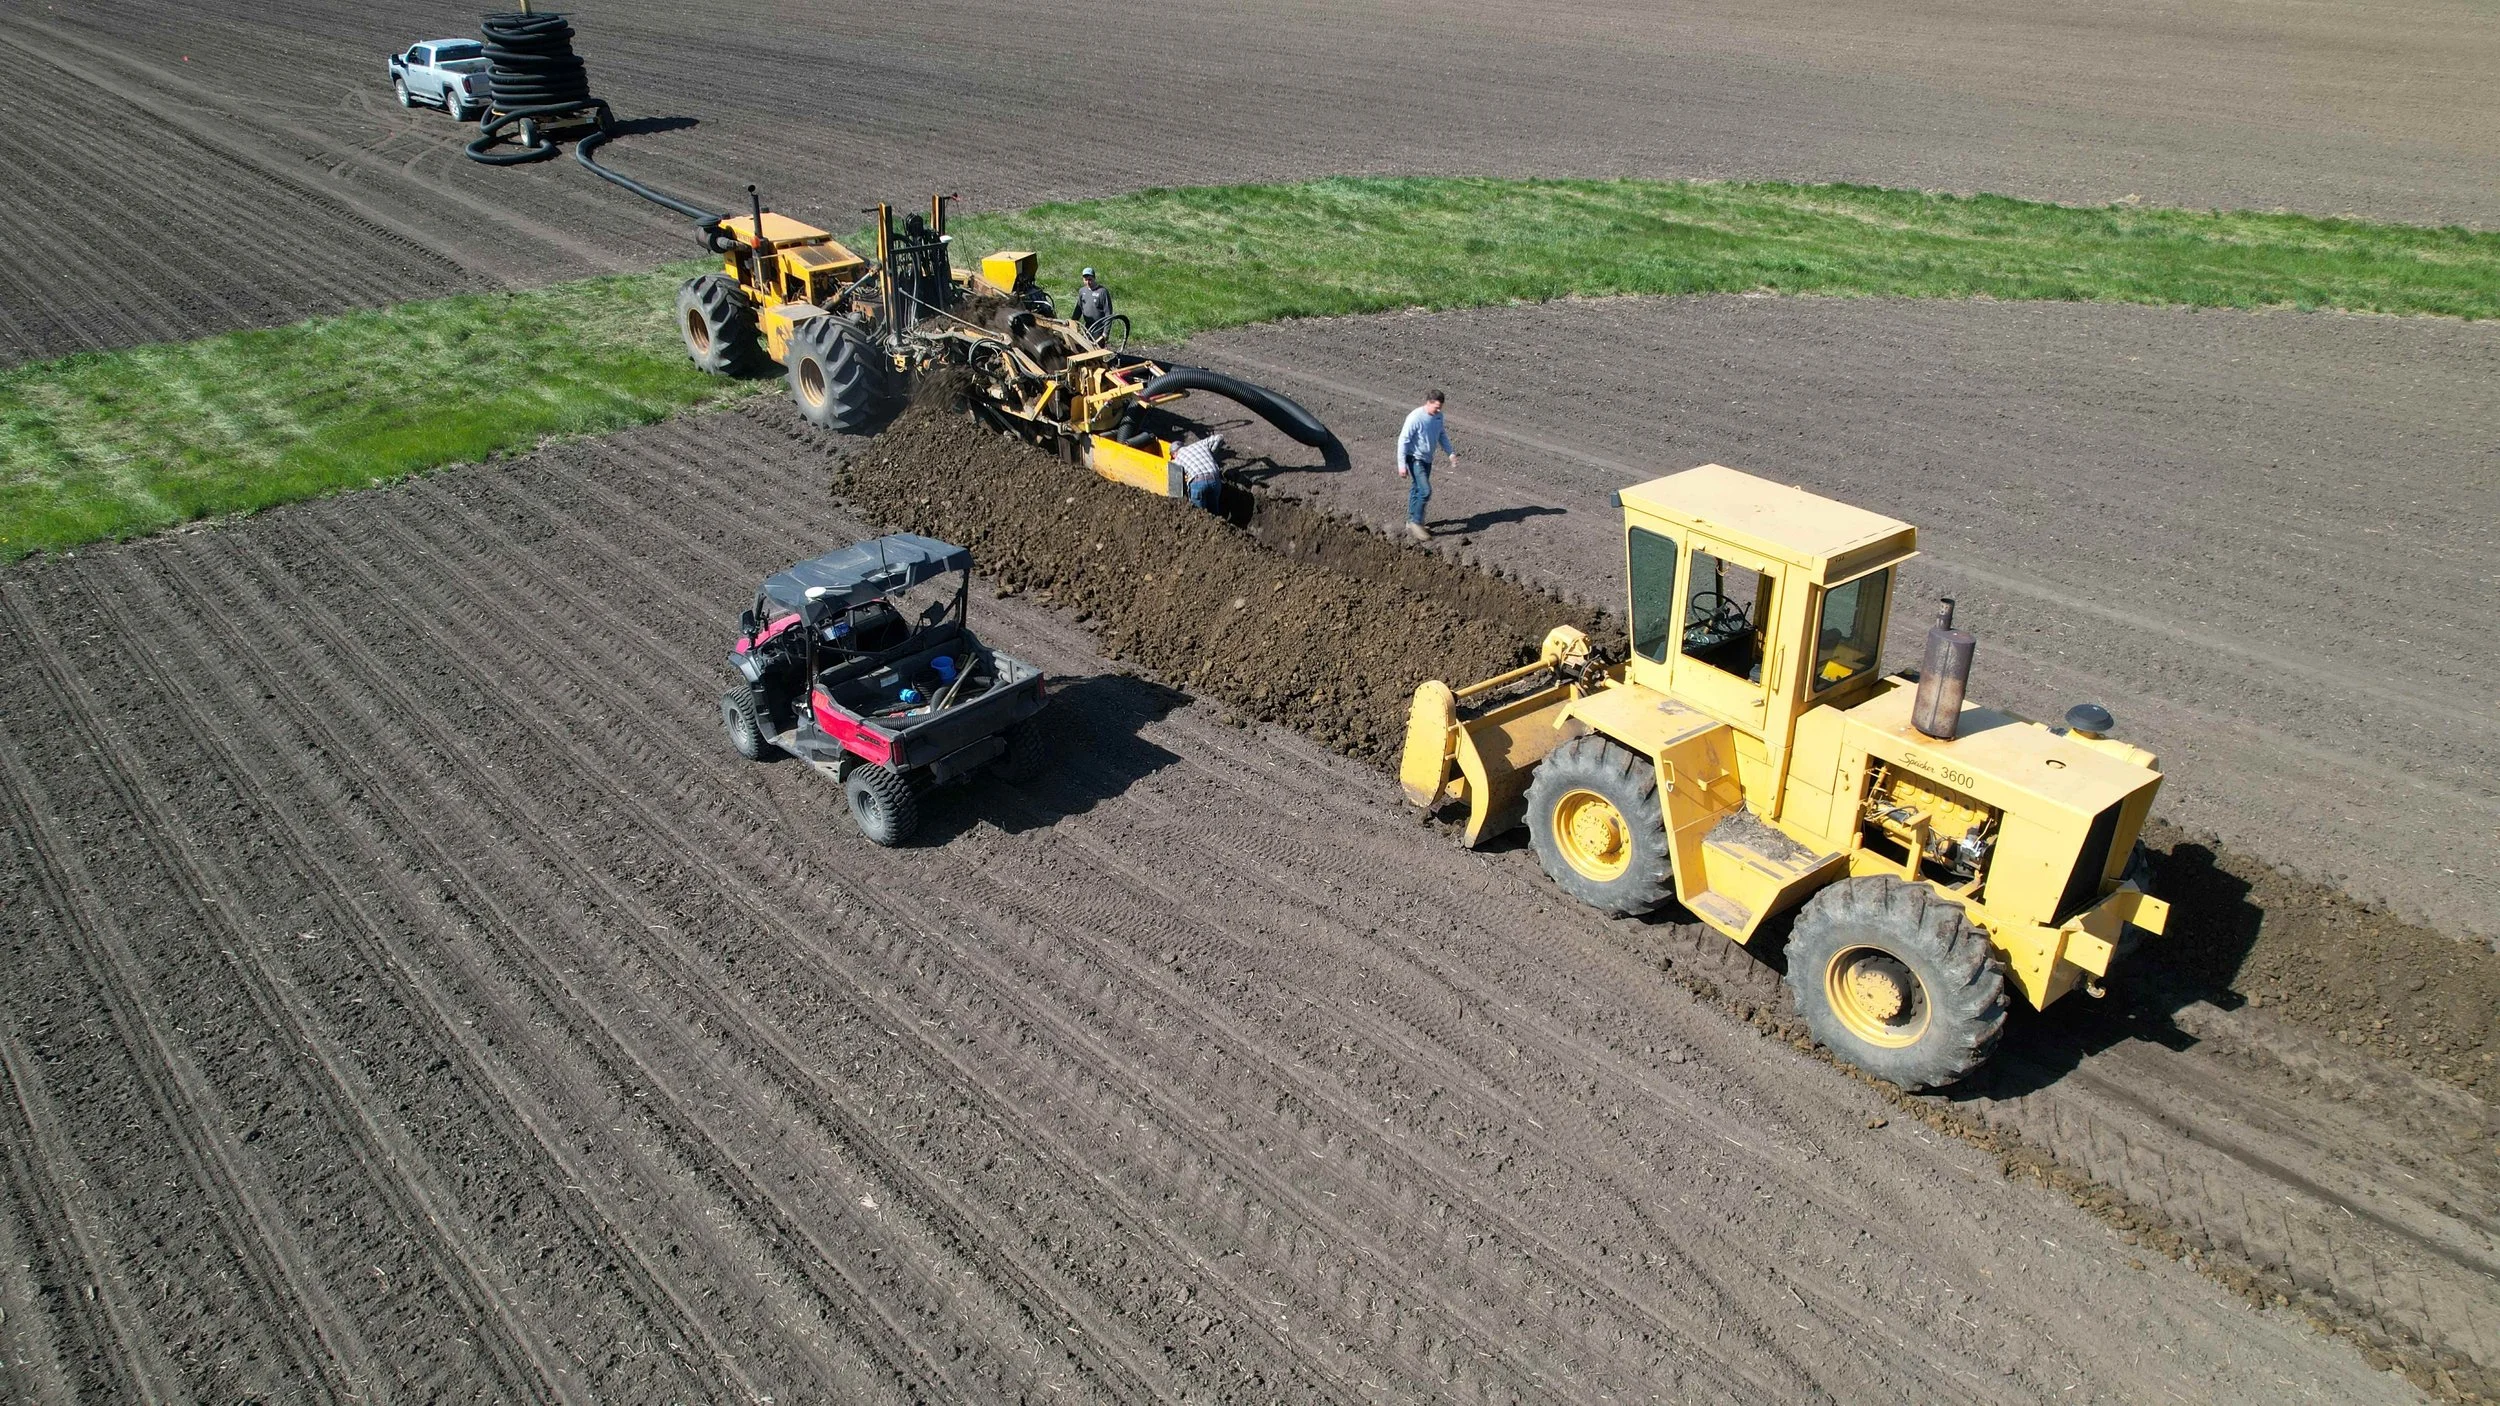
Bird’s eye view of the Double S crew laying perforated corrugated plastic pipe from the wetland to the main tile line in the nearby field.

The pickup truck at the top of the photo is pulling a spool of perforated, corrugated plastic tile. The tiling machine (partially parked on the grass) digs the channel and inserts the tile into that channel. The machine in the rear then pushes the earth back into the channel covering the newly deposited tile.

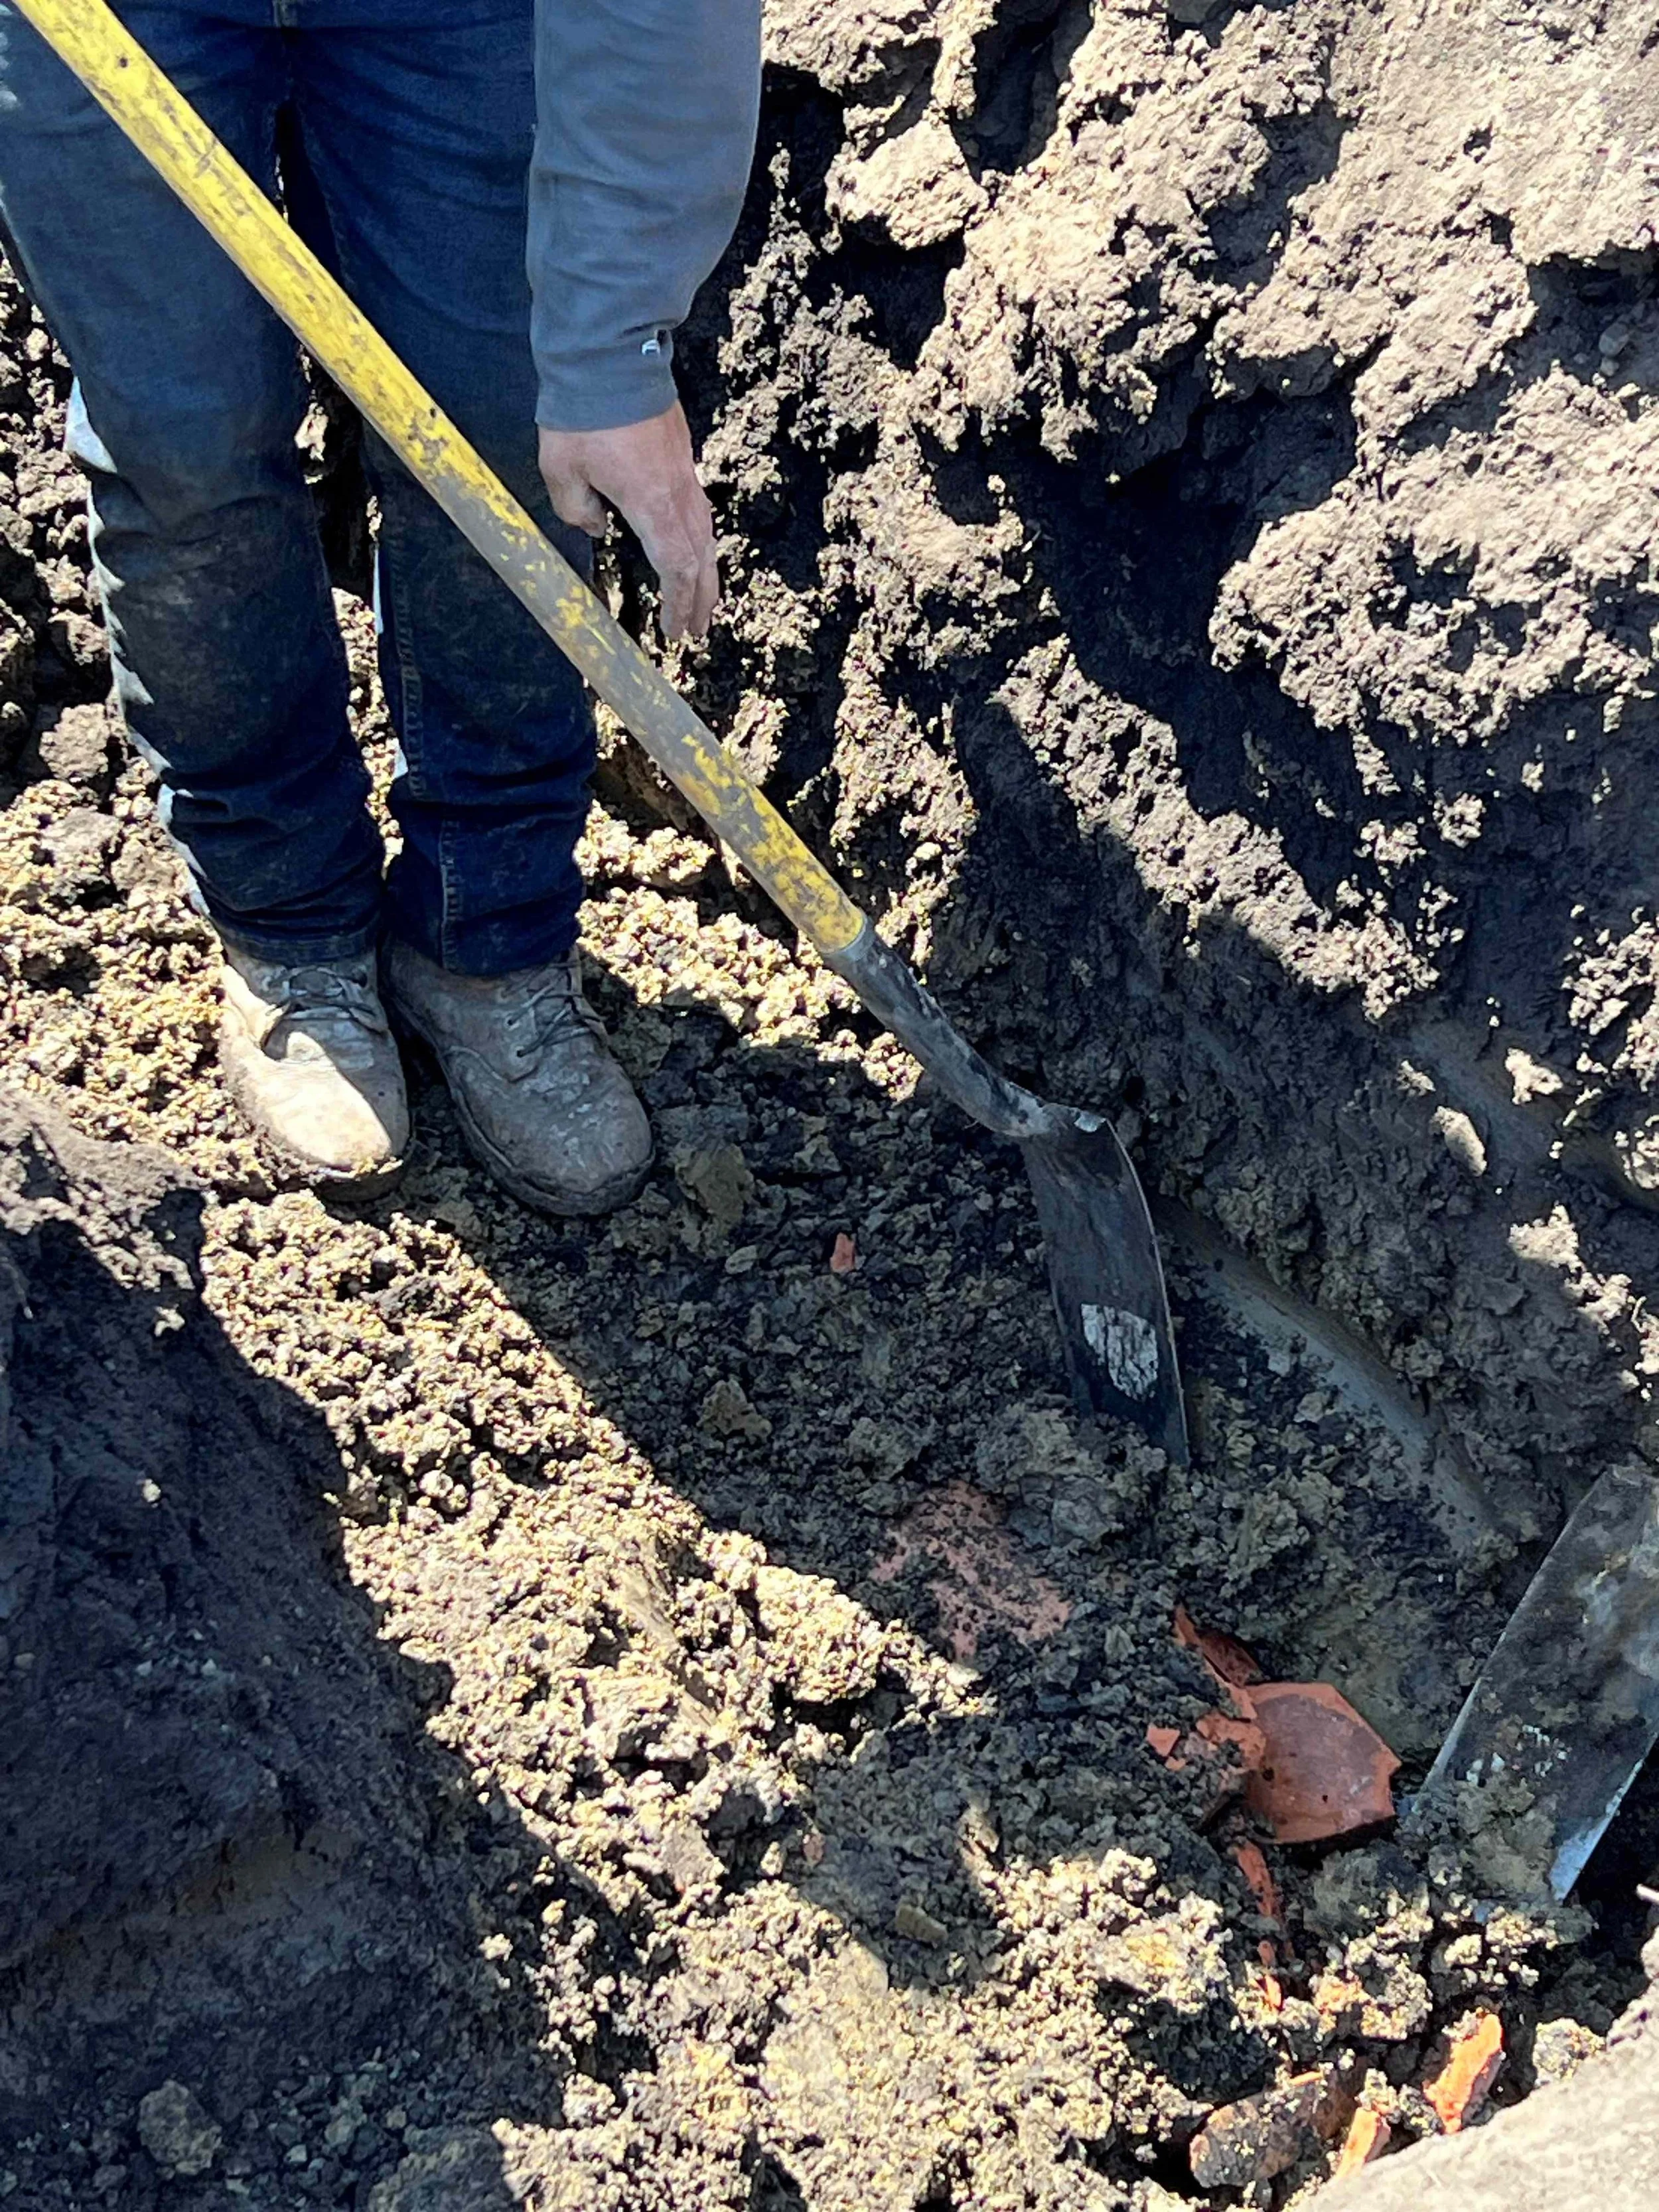
The crew then used a backhoe and shovels to access the original clay tile line to prepare it for connection to the newly-laid plastic tile line.

Titus and Travis connect the original clay tile system to the newly laid tile line and within minutes water was flowing into the wetland.

It is starting to look like a Smart Wetland!

Six months ago, we worked with several partners to build two wetlands at Feather Prairie Farm near Dwight, IL. The construction process was impressive. Over 5,000 cubic yards of earth were moved and precisely shaped into a wetland in a few days. Our partners at the Illinois Land Improvement Contractors Association, the builders of most of our wetlands, make it look so easy. However, looking at all that newly moved soil doesn’t allow the wetland’s actual shape to be easily seen up close or even from above. However, once water fills a new wetland, its features are clear.

Since all of our wetlands are designed and built to account for the existing landscape at a particular location, Dr. Jill Kostel, our wetland engineer, uses her expertise to develop a plan that takes advantage of the existing landscape. In the case of the Feather Prairie Farms wetland, the right design required a much narrower curving layout to be built than any of our previous wetlands. In addition, it includes a couple of islands to ensure that the nitrogen-laden ag tile drainage water moves through the wetland slowly enough to encourage the breakdown of nitrate.

This photo was taken on Feb. 18, 2023 at Feather Prairie Farm near Dwight, IL. The Smart Wetland is the large waterbody in the center of the photo. The small waterbody in the upper left is a small pond and the darker area in the foreground of the photo shows the smaller second wetland scrape.

While the wetland was built in August of 2022, there are still finishing touches being added in 2023. Currently, one tile system is draining into the wetland from the east (left side of photo), and another system will be connected to the wetland from the southwest (right side of photo) in the next few months. Once that drainage system is linked, the wetland could treat water from 60 acres of cropland.

The wetland and buffer have been frost-seeded. In late May or early June, various  water-loving plant plugs and bulbs will be installed in the wetland. As the bulbs and plants grow and get established, the water levels will be slowly increased. These plants will support the bacteria needed to break down the nitrate. We will be providing updates on those changes as they occur this year. Also, we will be doing another blog post about the second wetland (dark area in the foreground of the photo) at this location in the future.

Feather Prairie Farms wetlands immediately after construction, August 2022.

Feather Prairie Farms before wetland construction, July 2022.

Jean McGuire is the Field Outreach Specialist for our program and the face of TWI in the counties where we work. She works with our partners to identify landowners who may have an interest in building a Smart Wetland on their property. She was raised with seven siblings on a row crop-livestock farm which they now co-own and farm.

The Mississippi River Network provided support for developing this blog. Consider becoming a River Citizento help “clean up and protect our country's greatest River.”

The proof is in the wetland! Water quality monitoring shows Smart Wetlands’ effectiveness

The ability of wetlands to improve water quality in different applications (e.g., municipal, industrial, and agriculture) has been well-studied. The research has shown that wetlands, particularly treatment wetlands, are very effective at removing excess nutrients, herbicides/pesticides, heavy metals, etc. While I love reading and diving deep into this research, it is not necessarily exciting reading to our farmers. They are more interested in seeing firsthand a tile-treatment wetland on a local working row-crop farm and the proof that this investment is working as promised.

So, we have been partnering with professors and students at local universities and colleges to monitor the water quality going into and out of three Smart Wetlands that we designed and implemented with our landowners. We have nine years of monitoring data between the three wetlands.

To evaluate nutrient removal, we take samples for nutrient concentrations at the inlet and outlet of each wetland and measure the water flow. With these two measurements, we can calculate nutrient mass or pounds of nitrate and phosphorus removed by the wetland. Several parameters can impact nutrient removal, such as the inlet concentration, flow rate (impacted by rainfall), temperature, wetland age, soil organic carbon, plant community development, flow pattern, etc. Below are just a few results highlights comparing the three monitored wetlands with some short explanations. Check in with this website and Smart Wetlands’ social media in the future to see more data being presented and research findings explained.

TWI designed and implemented two wetlands in Bureau County, “BC1” in 2015 and “BC2” in 2016. In partnership with the University of Illinois-Chicago (UIC), water quality monitoring began the following spring or summer as the wetland plant community entered its first growing season.

Flow was monitored continuously and water quality samples were taken at the inlet and outlet daily. While both wetlands successfully remove nitrate-nitrogen, there are differences between the two wetlands in terms of efficiency (Figure 1A) and amount of mass removed (Figure 1B). The differences can be attributed to design and site factors.

The BC1 and BC2 wetland sites are similar in size; however, the treatment area of BC1 is around 1% of the contributing drainage area, whereas BC2’s treatment area to contributing drainage area is 3.6%. BC1 had upland soils as its base media growth, whereas BC2 had a hydric soil base (wetland/saturated soil) that was more carbon-rich, allowing more denitrification to occur right from the start. As the carbon levels built up in BC1 after each growing season, its removal efficiency increased, except in the fall of 2017 when the wetland dried up and the carbon was released as CO2 to the atmosphere. BC2 has never dried up due to a more consistent inlet flow throughout the year, particularly in the summer, so its carbon level continued to increase.

Figure 1A. Nitrate-nitrogen removal efficiency for BC1 (blue bars) and BC2 (green bars) over the sampling years.

Figure 1B. The total amount of nitrate removed in pounds

In 2019, a TWI-designed tile-treatment wetland was installed on Illinois Central College’s Demonstration Farm on the East Peoria campus. Its soil base was upland soils. Through a collaboration between TWI, ICC, Illinois Corn Growers, Waterborne Environmental, and Illinois State University, rigorous data collection began in 2021 for the tile-treatment wetland. To date, data has been analyzed through May 2022.

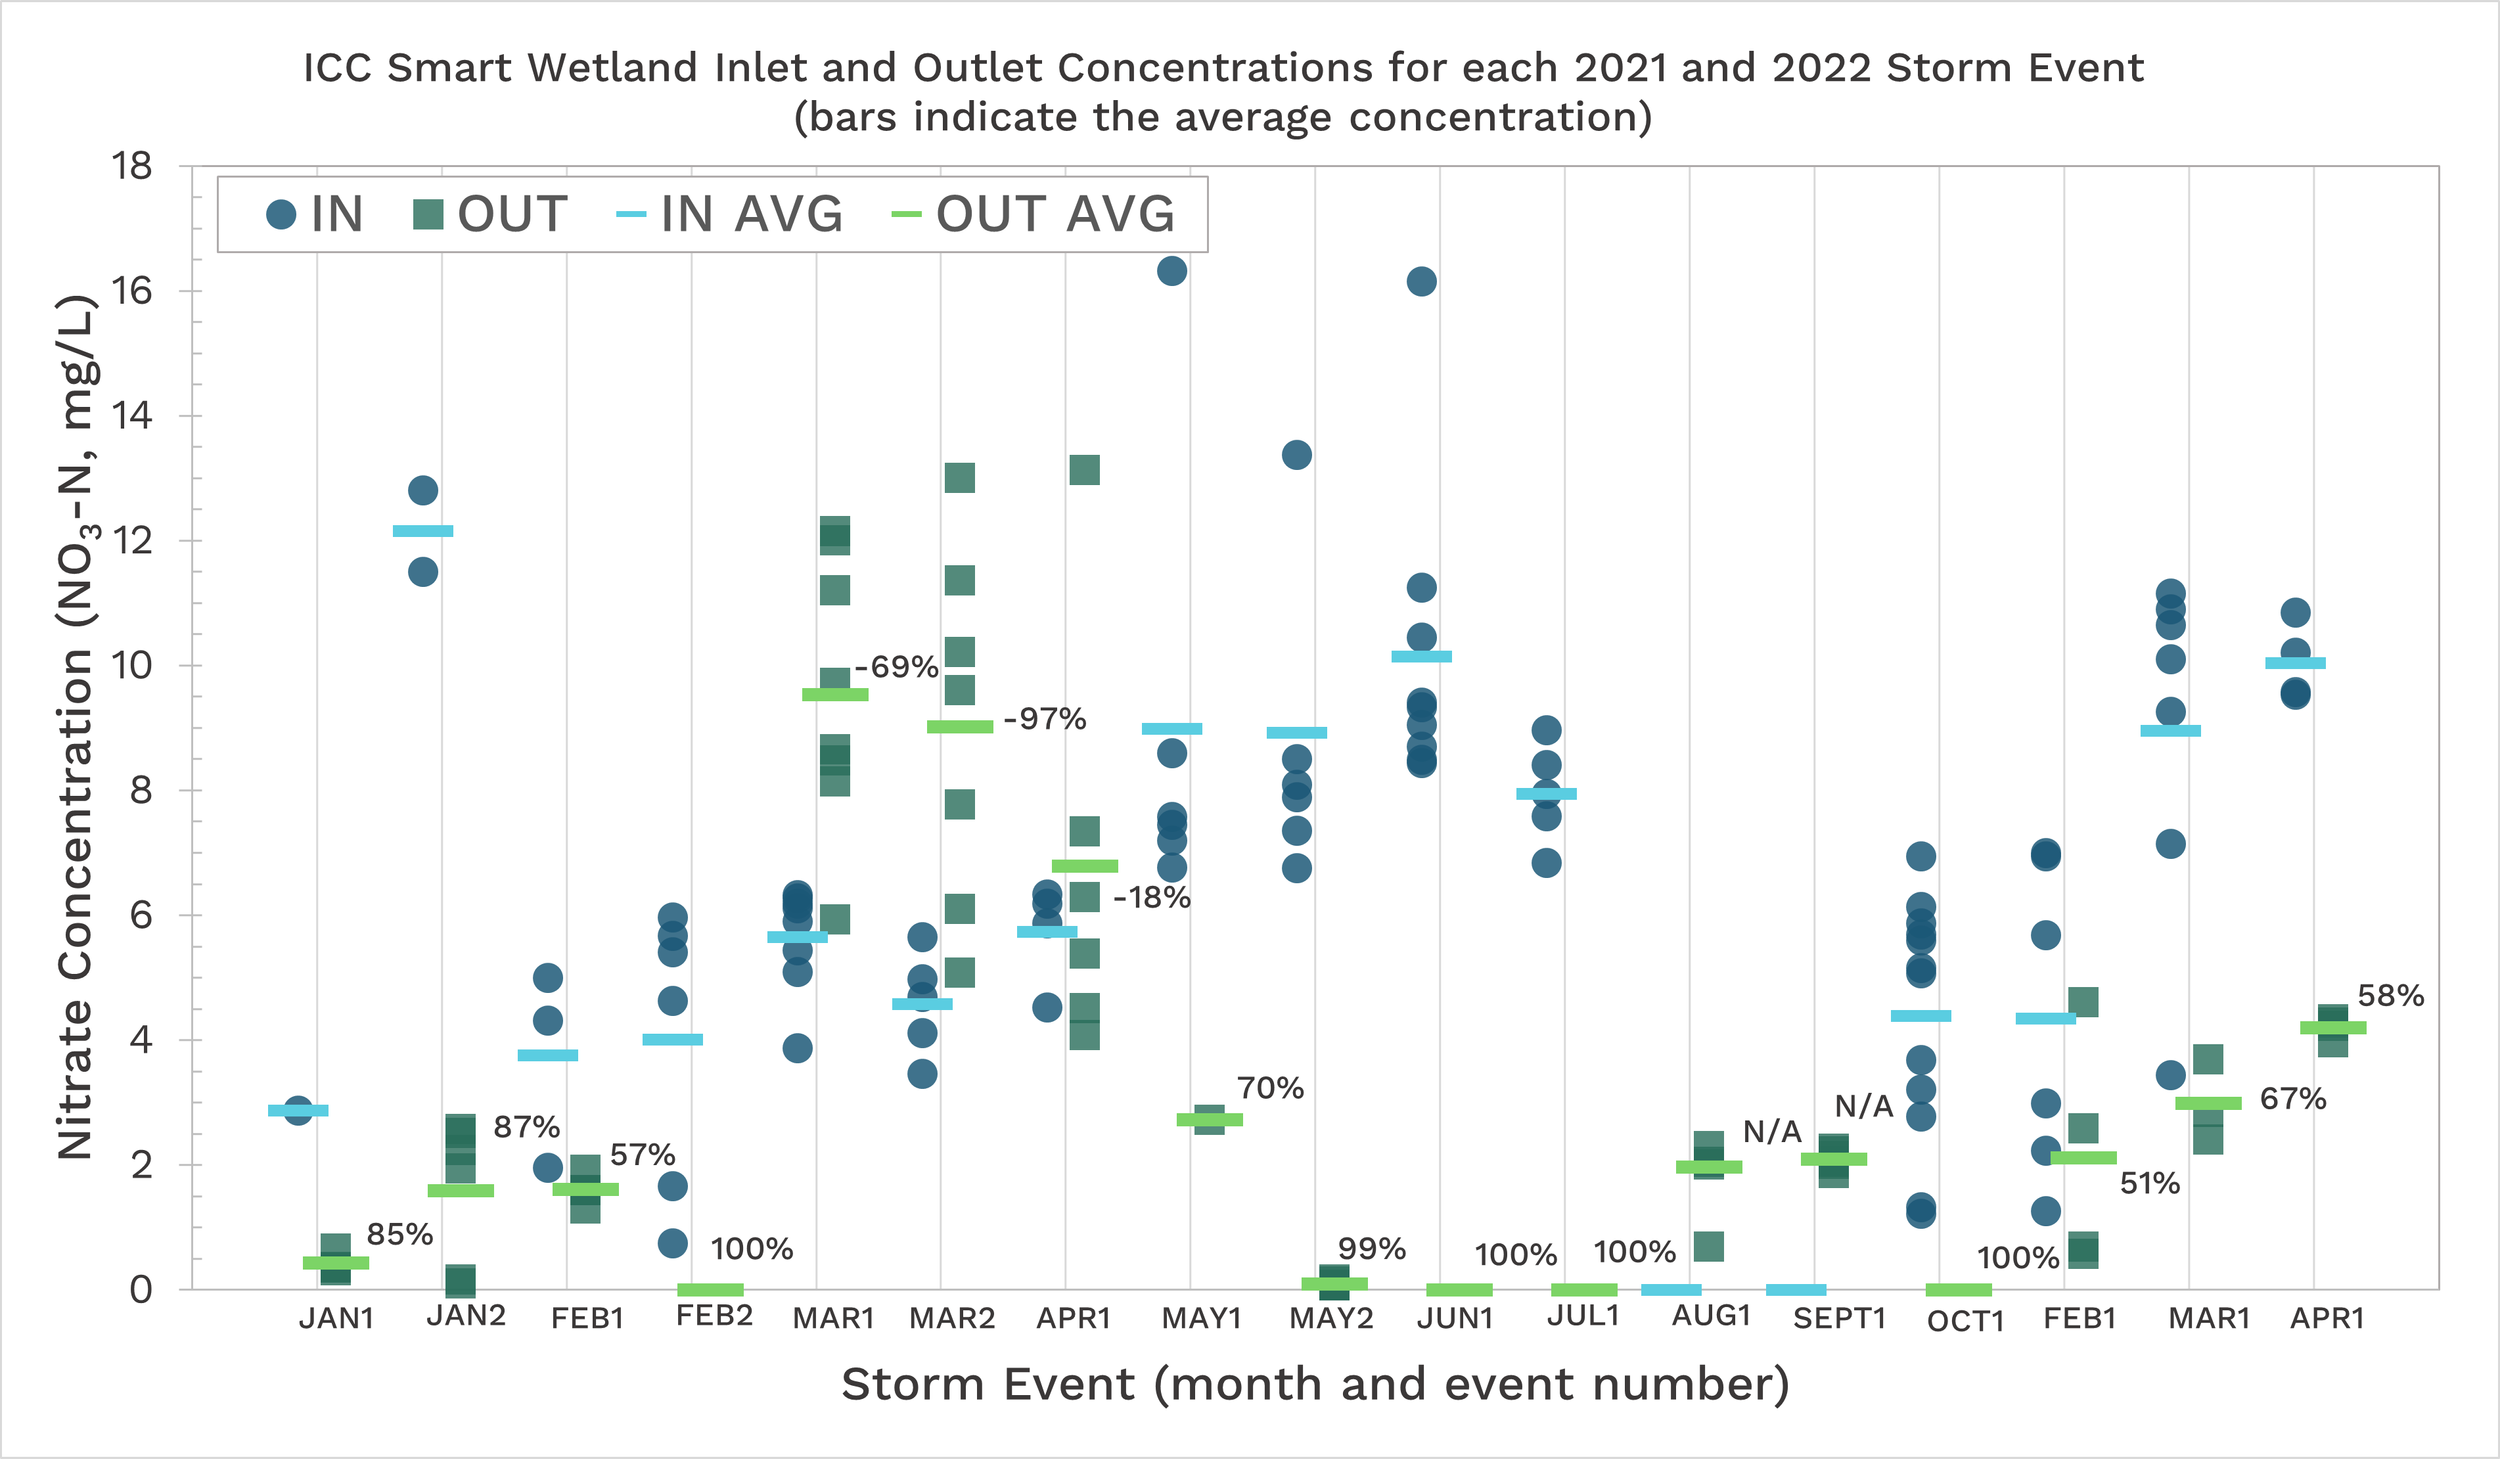
Unlike the Bureau County wetlands, the ICC samples are taken based on a set volume passing the collection point versus daily, so these samples essentially capture rainfall events when the “first flush” of nutrient flow through the tile drainage. The data show that the nitrate levels leaving the wetland are much lower than the inlet concentrations.

In 2021, we saw zero nitrate leaving the system in some cases, as evaporation was greater than the flow into the wetland (see Figure 2). In spring 2021, the wetland was exporting nitrate and total phosphorus and dissolved phosphorus. This may be due to the soils and sediments getting disturbed and mixed by the heavy rainfall or the presence of waterfowl nesting and feeding in the wetland.

Our water quality monitoring at all three wetlands demonstrates that the sites effectively remove significant nutrients from tile drainage water over a large part of the year. Our findings have also pointed to ways that we can further enhance the practice to make Smart Wetlands work even harder!

Figure 2. The inlet (blue dots) and outlet (green squares) concentrations for the Illinois Central College Smart Wetland for each storm event. The blue and green bars represent the average concentration for the inlet and outlet, respectively, for each storm event. The % number represents the removal efficiency based on the average concentrations. N/A means that no inlet samples were taken due to autosampler error.

Jill Kostel leads the project team as TWI’s Senior Environmental Engineer and primary designer of Smart Wetlands. She also works to develop new partnerships to help spread constructed wetlands widely in Illinois.

The Mississippi River Network provided support for developing this blog. Consider becoming a River Citizen to help “clean up and protect our country's greatest River.”

Putting natural processes to work -- How Smart Wetlands remove nitrogen and phosphorus

With TWI’s Smart Wetlands designs, we are simply providing the opportunity for wetlands to do what they all do naturally. By intercepting the tile water and allowing it to slow down and gently flow through a shallow wetland full of native plants, the naturally occurring processes adsorb/absorb, transform, sequester, uptake, trap, and remove nitrogen and phosphorus and other chemicals. All these activities occur throughout the different wetland components: the water; the living biota (plants, algae, fungi, and bacteria); the dead biota or litter (decomposing residual plant matter); and the underlying soils (sediment). We design  the Smart Wetlands in a manner to provide the best conditions to enhance some of these processes. 

You would think that all the abundant green native vegetation in a wetland is responsible for removing most of the excess nitrogen and phosphorous entering the wetland, since plants use these nutrients to grow. Wetland plants do uptake inorganic nitrogen and phosphorus forms through their roots and/or foliage during the spring and summer and convert them into organic compounds for growth. However, this only stores the nutrients temporarily. Most of these assimilated nutrients are released back into the water and soils when plants grow old and decompose during the fall and winter.

But together with bacteria, wetland plants do play a key role in the primary removal processes for nitrogen and phosphorus. Nitrogen removal involves bacteria (or microbes) that conduct numerous chemical reactions that we can’t see. These ubiquitous bacteria are found on the solid surfaces within the wetland, such as soil, litter, and submerged plant stems and leaves. The main transformation processes are ammonification (organic nitrogen converted to ammonia), nitrification (ammonia converted to nitrate or nitrite), and denitrification, where nitrate (NO3) is converted into harmless nitrogen gas (N2), which composes 85% of our atmosphere.

How is nitrogen removed?
For Smart Wetlands, we rely on denitrification to reduce the high nitrate levels in agricultural tile drainage runoff. Denitrification requires three items to be present at the same time – denitrifying bacteria (present in all soils), nitrate (in the tile water), and available carbon (right side of the above graphic). Carbon serves as the bacteria’s food source for growth and energy, and wetland plants are a vital source of this carbon. Denitrification occurs when there is little to no oxygen available so the bacteria switch to “breathing” in nitrate instead of oxygen. These low oxygen zones are found in the top few centimeters of the sediment and within the biofilms growing on the plant stems and leaves. Shallow wetlands create these low-oxygen zones and allow for the nitrate to reach these zones. Since denitrification is performed by bacteria, the process is temperature-dependent. The rate of microbial activity increases in the summer months due to higher air temperatures and increased sunlight warming up the cool tile water.

How is phosphorus removed?
Unlike nitrogen, phosphorus is removed primarily through physical and chemical processes. Phosphorus typically enters wetlands attached to small soil particles (particulate form) and as phosphate (dissolved form of phosphorus). When water enters the wetland, it spreads out and slows down due to the vegetation, which acts like a filter allowing any particles or suspended material to settle to the bottom of the wetland. Particulate phosphorus is deposited in wetlands in the form of sediment. Phosphate (PO4) accumulates quickly in sediments by chemically binding to aluminum, calcium, and iron through adsorption and precipitation processes. Wetland soils have a limited amount of phosphorus they can hold. To continuously remove phosphorus, new soils need to be ‘built” within the wetland from remnant plant stems, leaves, root debris, and undecomposable parts of dead algae, bacteria, fungi, and invertebrates. The growth, or accretion, of new material in the wetland is the only sustainable removal and storage process for phosphorus.

Jill Kostel leads the project team as TWI’s Senior Environmental Engineer and primary designer of Smart Wetlands. She also works to develop new partnerships to help spread constructed wetlands widely in Illinois.

The Mississippi River Network provided support for developing this blog. Consider becoming a River Citizen to help “clean up and protect our country's greatest River.”


Put a pin it! Share your conservation story

If you are working to create healthy soil, clean water and keep farms profitable in the process, the Illinois Sustainable Ag Partnership (ISAP) wants to hear and share your story.

ISAP is comprised of 15 organizations working collaboratively to encourage the adoption of sustainable and profitable production practices that improve soil health and restore local waters. The Partnership’s primary efforts are focused on supporting Illinois agriculture in meeting the goals of the Illinois Nutrient Loss Reduction Strategy by using data and education to increase the technical capacity of ag professionals while minimizing risk and increasing profits for farmers. The Wetlands Initiative (our parent organization) is a founding member of ISAP.

Programs are based on a combination of academic and on-farm research data, employing a “train-the-trainer” approach that results in a cadre of professionals who are able to inform and influence producers across the state. Programs can be grouped into four “Program Pillars” which guide the education, research, and outreach efforts of the Partnership.

The Conservation Story Map is one of the groups ways of tell success stories and sharing the expertise gained by farmers and ag professionals with others looking for ways to help their farms and clients become more sustainable. We encourage you to connect with individuals and businesses listed on the map and invite you to put your own pin on the map